1.画点状图
import pylab as pl
import matplotlib
x=[10,20,11,12,15,25]
y=[3,6,9,8,7,4]
co=[1,2,3,4,5,6]
fig1=pl.figure()
for i in range(0,len(x)):
pl.plot(x[i],y[i],'o',color=cm(co[i]*1.0/6)) #画点状图
plt.scatter(random(10), random(10), marker='x', color=colors[0])
pl.text(x[i],y[i],str(y[i])+'*',color='red') #在某个位置写字
pl.xlim(0,45)
pl.title('cluster graph ')
pl.show()
#=========================
pl.bar(x,y) #画柱状图
2.柱状图
import matplotlib.pyplot as plt
import numpy as np
dict = {'A': 40, 'B': 70, 'C': 30, 'D': 85}
for i, key in enumerate(dict):#Circulate both index and value(Here is key)
plt.bar(i, dict[key], color='r', width=0.2)
plt.xticks(np.arange(len(dict))+0.1, dict.keys())#Translation
plt.yticks(dict.values())
plt.grid(True)
plt.show()
plt.bar(x_list, value_list, color='b', width=0.2,alpha=0.5)
plt.bar(x_list, value_list2, color='r', width=0.2,alpha=0.5)

plt.xticks(np.arange(len(x_list))+0.1, x_list, rotation=70)
plt.legend(['good user','bad user'])
plt.show()
3.折线图
x = []
yQ = []
yARI = []
delta = 0
while delta <= 1.0:
x.append(delta)
ARI = Evaluation.calculateARI(true_labels, predict)
Q = Evaluation.calculateQ(G, communities)
yARI.append(ARI)
yQ.append(Q)
delta += 0.1
# end of while
pl.plot(x, yARI)
pl.plot(x, yNMI)
pl.plot(x, yQ)
pl.plot(x, yPurity)
pl.legend(('ARI', 'Q'), loc='upper right')
pl.ylim(0, 1.1)
pl.show()
4.画多个子图
fig1=plt.figure()
fig1.add_subplot(4,1,1)
plt.plot(x1,y1)
fig1.add_subplot(4,1,2)
plt.plot(x2,y2)
fig1.add_subplot(4,1,3)
plt.plot(x3,y3)
fig1.add_subplot(4,1,4)
plt.plot(x4,y4)
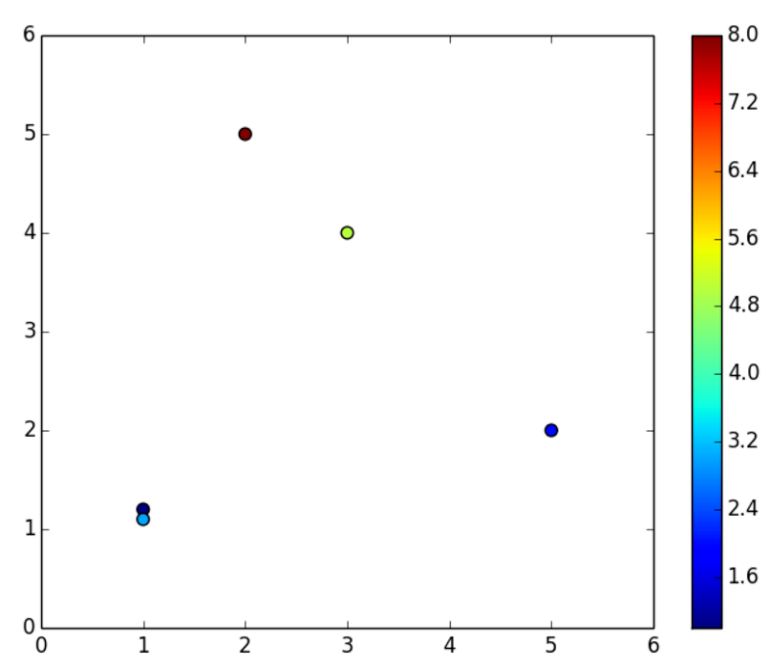
5.带有颜色深浅的散点图:
x=[1, 1, 2, 3, 5]
y=[1.2, 1.1, 5, 4, 2]
z=[ 1, 3, 8, 5, 2 ]
plt.scatter(x, y, c=z,s=50)
plt.colorbar()
plt.show()
效果:
6.颜色
颜色之间的对应关系为
b—blue c—cyan g—green k—-black
m—magenta r—red w—white y—-yellow
有三种表示颜色的方式:
a:用全名 b:16进制如:#FF00FF c:RGB或RGBA元组(1,0,1,1) d:灰度强度如:‘0.7’
7.点的形状
标记风格有多种:
. Point marker
, Pixel marker
o Circle marker
v Triangle down marker
^ Triangle up marker
< Triangle left marker
> Triangle right marker
1 Tripod down marker
2 Tripod up marker
3 Tripod left marker
4 Tripod right marker
s Square marker
p Pentagon marker
* Star marker
h Hexagon marker
H Rotated hexagon D Diamond marker
d Thin diamond marker
| Vertical line (vlinesymbol) marker
_ Horizontal line (hline symbol) marker
+ Plus marker
x Cross (x) marker
8.线的形状
符号和线型之间的对应关系
- 实线
-- 短线
-. 短点相间线
: 虚点线
plt.plot(y, 'cx--', y+1, 'mo:', y+2, 'kp-.');
9. 画网络图
对网络数据画图。需要安装networkx网络。
import networkx as nx
pos=nx.spectral_layout(G)
clusterResult=[ ]是节点的社区划分结果
nx.draw(G,with_labels=True,node_color=clusterResult,node_size=300)
plt.show()